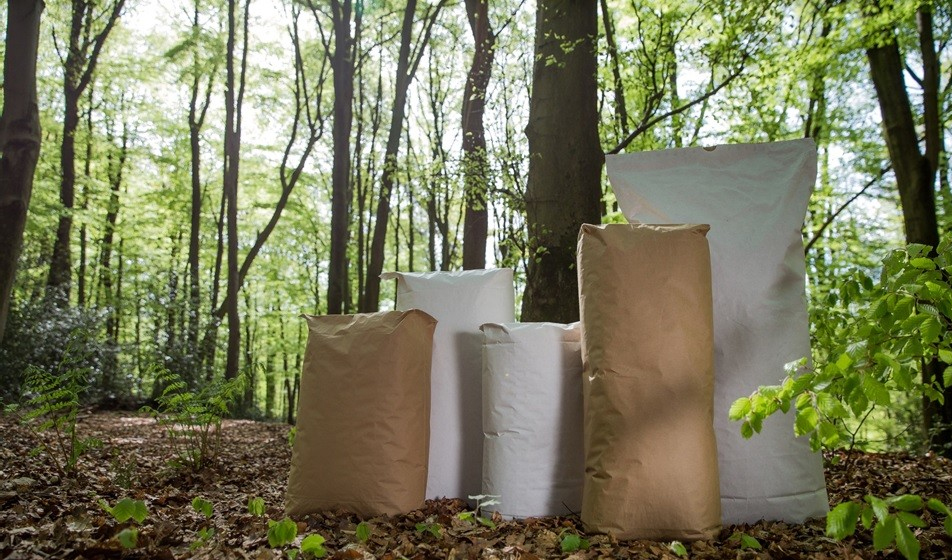
The European kraft paper and paper sack industry has a long tradition of tracking and communicating its environmental impact. Between 2007 and 2021, the carbon intensity of a single paper sack was reduced by 28%. This is the result of the latest carbon footprint analysis on European paper sacks. It was conducted by the Swedish research institute RISE on behalf of the European Paper Sack Research Group (ESG), a collaboration between EUROSAC and CEPI Eurokraft. Also, the fossil carbon impact per tonne of sack kraft paper was reduced by 26% during the same time. The most important findings are summarised in an infographic.
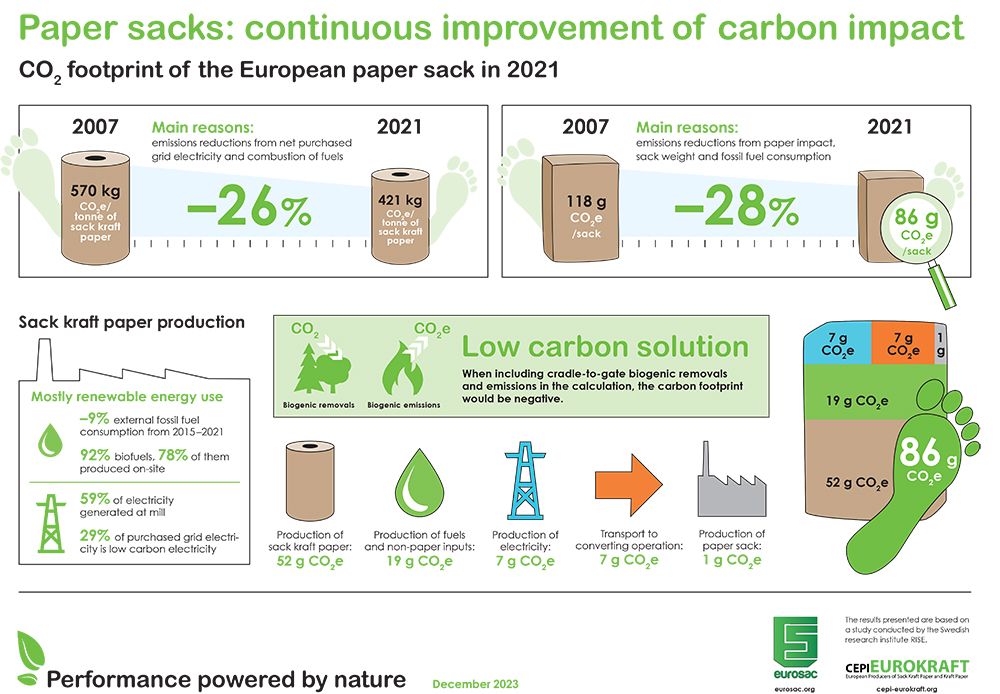
The recent LCA study by RISE reports a consistent downward trend in the cradle-to-gate fossil carbon impact of average European sack kraft paper and paper sacks. From 2018 to 2021, this course was continued: the impact per tonne of sack kraft paper was improved by 5% – from 442 kg CO2e[1] to 421 kg CO2e. Also, the fossil carbon footprint of paper sacks saw a slight amelioration of 1% – from 87 g CO2e[2] in 2018 to 86 g CO2e per sack in 2021. With 61%, emissions from the production of sack kraft paper are the dominating factor for the result of an average European paper sack.
On the road toward climate neutrality
The long-term figures show an impressive development. When comparing the recent data to the results from the first LCA conducted by the ESG in 2007, there is a significant reduction in fossil carbon impact per tonne of sack kraft paper of approximately 26% – from 570 kg CO2e to 421 kg CO2e. The reasons for that are predominantly fewer emissions from net purchased grid electricity and from the combustion of fuels consumed by the mills. When considered per paper sack, the reduction is even higher, from 118 g CO2e per sack in 2007 to 86 g CO2e per sack in 2021. This represents a 28% improvement. It can be attributed to reductions in sack weight and in fossil fuel consumption. “It’s good to see that even small steps lead to big changes in the long run. As our members are committed to continuously enhancing the sustainability of their manufacturing operations, we have been tracking our industry’s energy use and emissions for more than 15 years. This data gives us an understanding about which levers to pull to reach the next level of reducing our environmental impact,” explains Catherine Plitzko-Kerninon, General Delegate, EUROSAC. “As the entire value chain gains importance in a sustainable business conduct, more and more stakeholders are using our data to achieve insights how to master the road toward climate neutrality.”
Mostly renewable energy use
The reliance on fossil fuels in sack kraft production is decreasing. External fossil fuel consumption has been reduced by 9% from 2015[3] to 2021. A high degree of renewable energy sources is used in 2021. In total, biofuels account for 92% of all fuels consumed on-site, 78% of them are generated in the mill during the production process. Additionally, the mills produce 59% of their own electricity requirements. From the purchased grid electricity consumed by the mills in 2021, 29% was identified as “green” electricity[4].
Low carbon solution
As young trees grow, they absorb carbon dioxide (CO2) from the atmosphere. The carbon is stored in forest products such as paper sacks during their life cycle. When including the cradle-to-gate biogenic removals as well as emissions in the calculation, the carbon footprint would even be negative. “This reinforces the fact that paper sacks are a low carbon, potentially even a carbon negative solution,” resumes Plitzko-Kerninon. To also consider the end-of-life scenarios of paper sacks would even give a more complete picture from cradle-to-grave. However, this methodology is problematic due to data accuracy. “In a circular economy, recycling is, of course, the preferred scenario. The recycling of paper and board products has another advantage: it delays the stored CO2 from returning to the atmosphere,” explains Plitzko-Kerninon. “Therefore, our industry is committed to encourage and pursue the recycling of paper sacks after usage.”
DOWNLOAD THE FACT SHEETNotes
[1] the value for 2018 has been restated from 455 kg CO2e per tonne due to the identification of an error in the quantity of CaO (calcium oxide) considered in the life cycle inventory for sack kraft paper.
[2] the value for 2018 has been restated from 85 g CO2e per tonne due to the corrections to the paper footprint and due to the identification of an error in the quantity of PE considered in the average paper sack.
[3] For 2018–2021, there is a much larger reduction due to changes in the fuel mix used. But this number might be misleading because there was an increase before between 2015 and 2018. Therefore, we used the more realistic figure from 2015.
[4] Defined as low carbon electricity, i.e. generated by wind, solar, hydro, nuclear, etc. and supported by specific product certification.

